
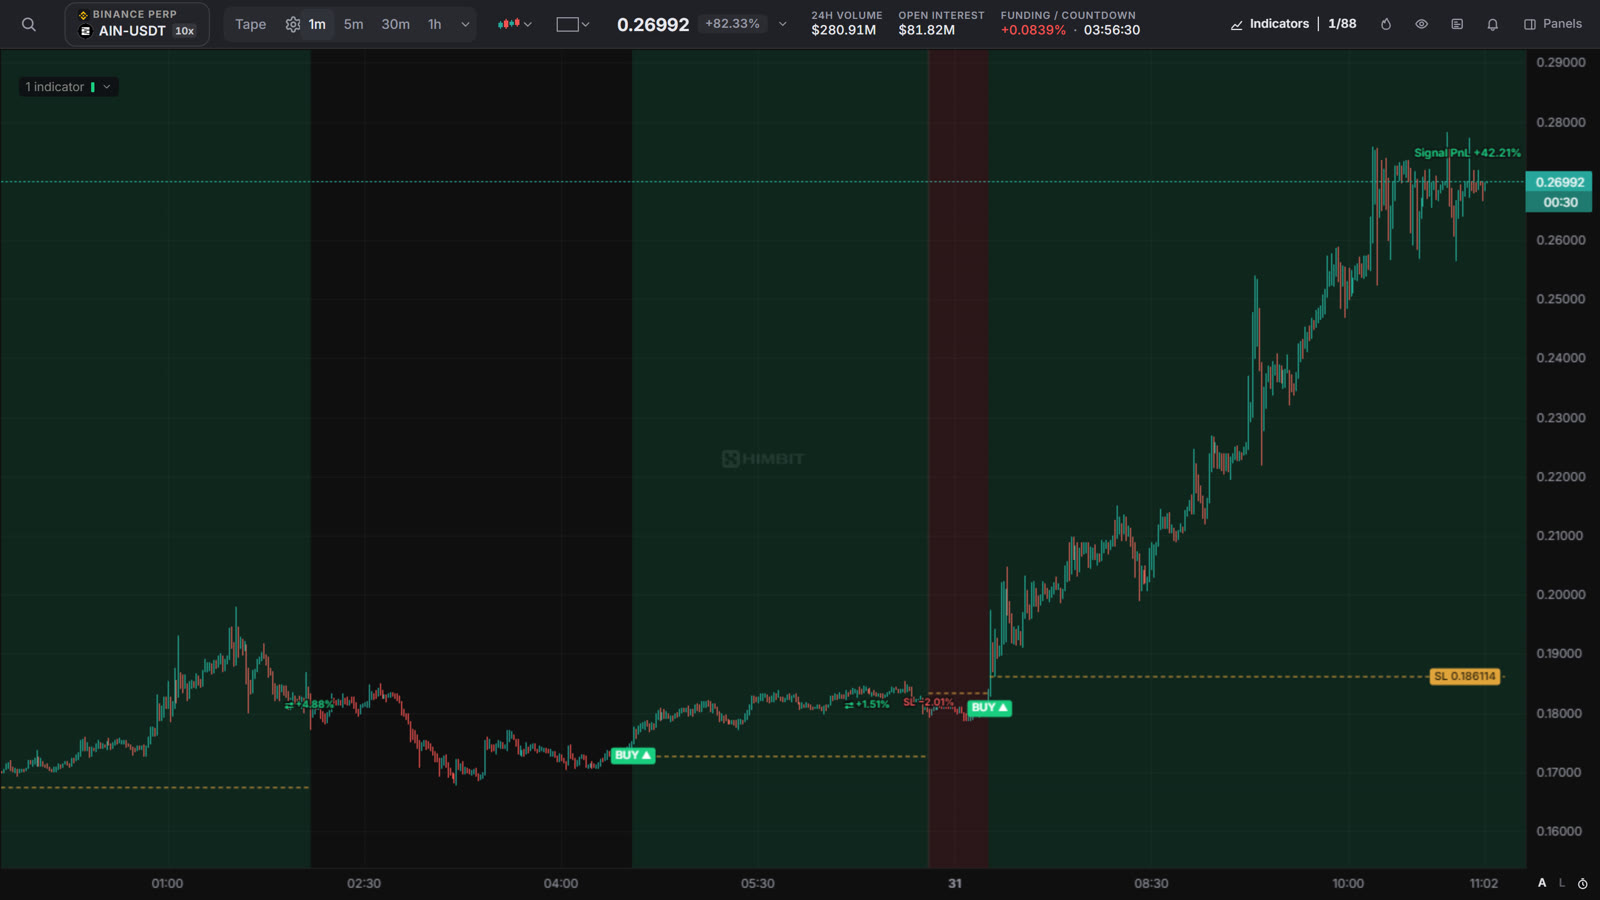
On 31 October AIN, the AINUSDT perpetual on Binance, rose about 82% in 24 hours. On the 1-minute chart the Vol Trend signal printed a BUY at 0.18980 at 07:16 (UTC+7), before most of that move. We wanted to know what the strategy did in the days before as well, so we replayed its last 20 trades bar by bar on Binance data, losses included.
The strategy in four rules
- Trend change. A Kalman filter smooths the close, with a band of ATR × 2 around it. A close that breaks out of the band turns the trend.
- Volume confirms. The volume delta of that candle has to point the same way. Without it the signal waits.
- With the EMA 200. Longs only above the EMA 200, shorts only below it.
- Stop, no target. The stop sits at ATR(200) × 3 from the entry. There is no take-profit: the trade runs until the stop is hit or an opposite signal closes it.
The last 20 trades
From 28 October 22:12 to 31 October 10:45 (UTC+7) the strategy took 20 trades on AINUSDT 1m. Only 8 of them made money. Added up, net of a 0.1% fee per round trip, they come to +39.49%.
- Wins and losses: 8 wins, 12 losses
- Average win: +8.63%. Average loss: −2.30%
- Biggest single loss: −3.55%
- Profit factor: 2.50
- The open trade: long from 0.18980, +44.16% at 0.27381 (31 October, 10:45)
Why it works: lose small, let winners run
Most of the time the 1-minute chart is noise, and the strategy pays for that noise in small stops of about 2%. What makes the difference is the other side. When a real trend starts, there is no target to cut it short, so the trade stays on until the trend itself turns.
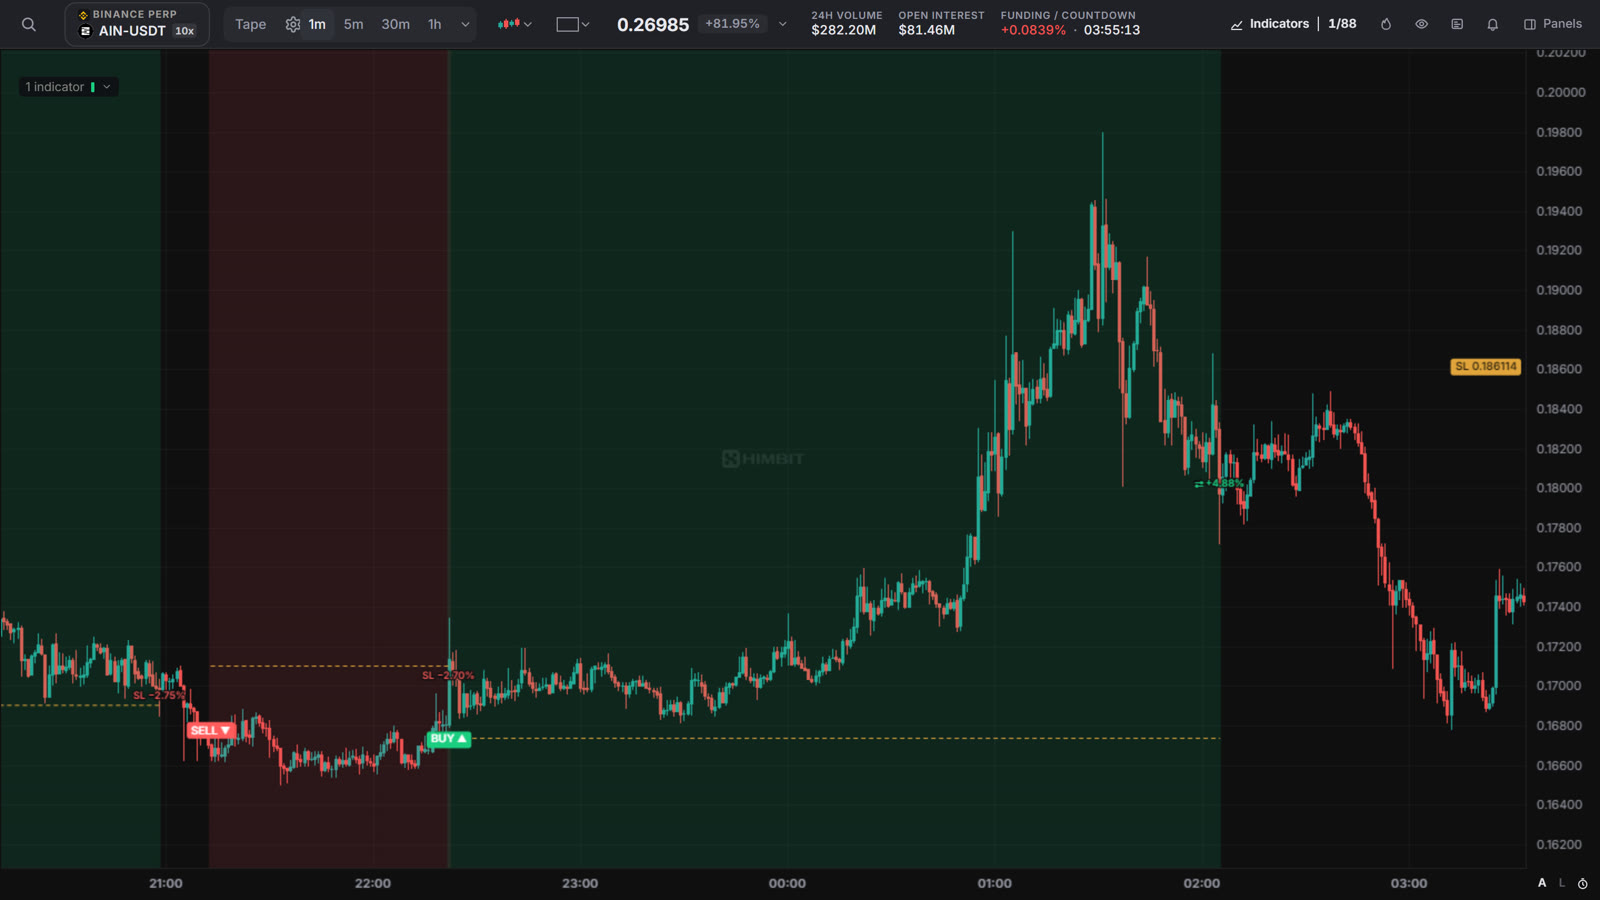
The honest version of the numbers: the 19 closed trades together come to −4.67%. The whole result rests on the one long that is still open. That is what this kind of strategy looks like. You accept a long run of small losses so that you are already in when the big move comes.
What to keep in mind
- This is a backtest, not a live account: no leverage, slippage or funding, and the last trade is not closed yet.
- 1 minute is the hardest timeframe. The indicator's own notes say no profitable setting was found on 1 to 5 minutes across the coins tested; 1h is the tested profile.
- The 20 trades come from one coin in one strong week. Past results do not promise future ones.
- This article explains a strategy. It is not investment advice.
Try it on your own chart
Open the Himbit chart for AINUSDT 1m, click Indicators and add Dynamic Volume Trend. You get the BUY and SELL tags, the stop line and the result of every trade drawn on the chart, free and with no sign-up. More about the chart is on the Market Open page.
常见问题
Is this a live trading record?
No. It is a backtest: the strategy's rules replayed bar by bar on Binance's AINUSDT 1-minute candles from 28 to 31 October 2026, net of a 0.1% round-trip fee, without leverage, slippage or funding. The last trade was still open when we measured it.
Where can I see these signals myself?
Open the Himbit chart, pick AIN-USDT on Binance, switch to 1m and add the Dynamic Volume Trend indicator. The BUY and SELL tags, the stop line and the result of each trade are drawn on the chart for free, with no sign-up.
Does the strategy work on every coin and timeframe?
No. The indicator's own notes say 1h is the tested profile, 15m and 30m work with thin margins, and on 1 to 5 minutes no profitable setting was found across the coins tested. AIN's 1m run here is one strong trend, not proof that 1m pays in general.
在 Himbit 上开始交易
用你自己的钱包交易 Hyperliquid 永续合约——非托管,无需 KYC。