
Most structure signals on a 1-minute chart are noise. SolAtlas throws almost all of them away and keeps about one trade a day per market. We wanted to see what that leaves, so we replayed its BUY / SELL rule on ten of the biggest Binance perps for the whole of October 2026, losses included.
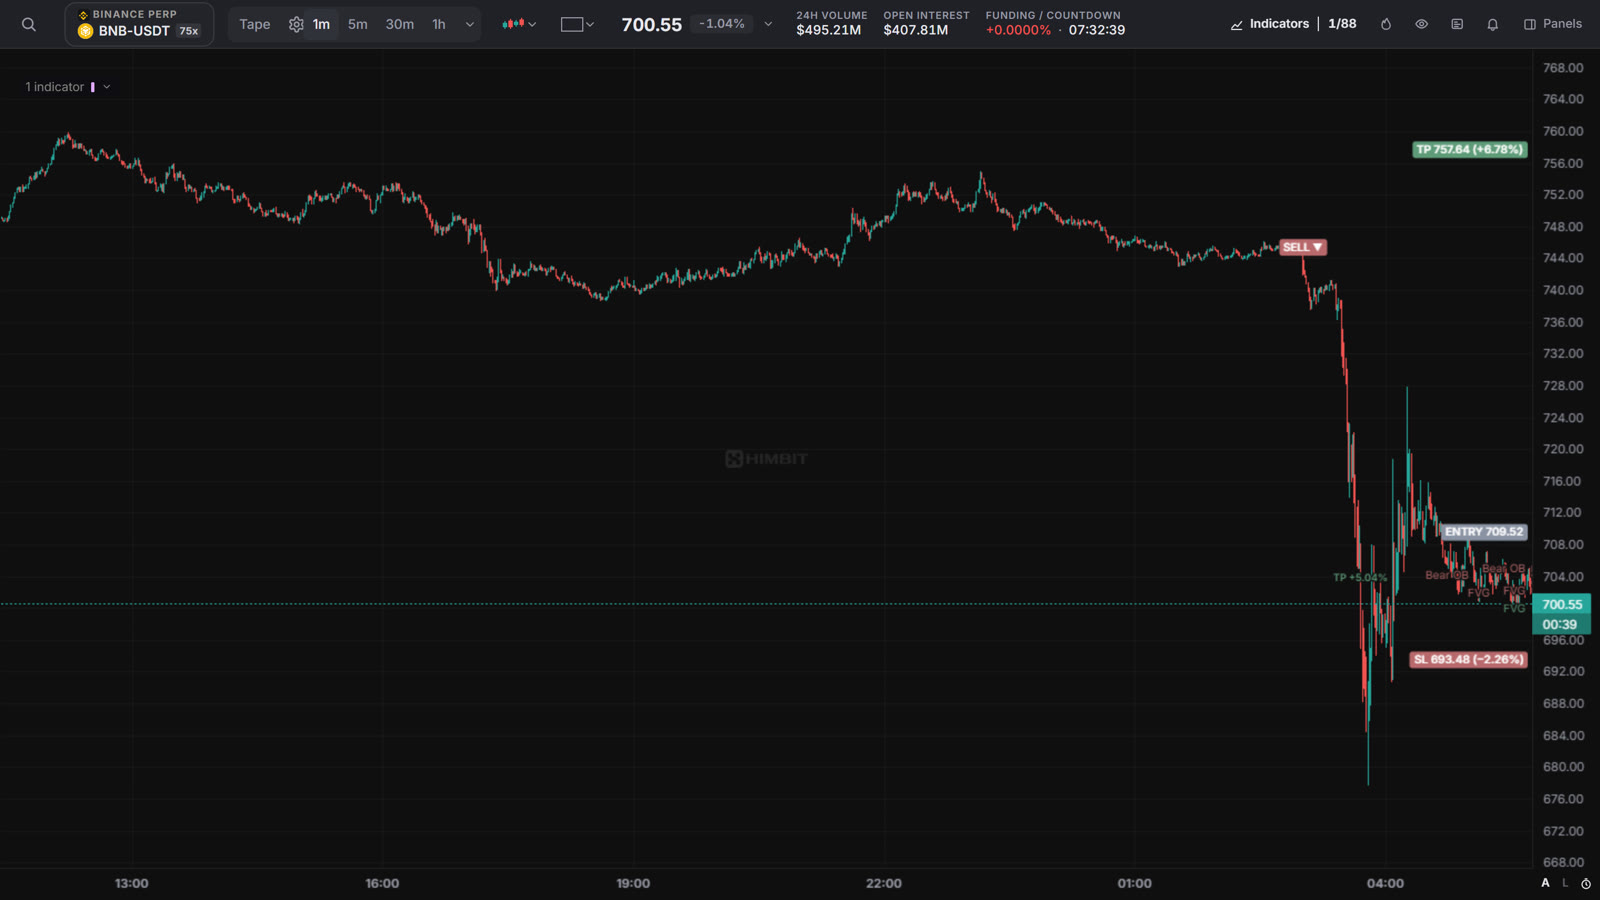
The strategy in four rules
- A real change of character. SolAtlas only counts a swing high or low after price has swept its inducement, the first pullback after the break. When a candle closes through the last swing on the other side, that is an IDM CHoCH, and a signal.
- With the EMA 200. BUY only above the EMA 200, SELL only below it. Signals against the trend are skipped.
- Stop at structure, target 3 × risk. The stop goes at the protected high or low of the move. The target is three times the distance from the entry to that stop.
- An opposite signal closes it. If an IDM CHoCH appears the other way before the stop or the target, the trade is closed at that candle's close, and the other side opens if the trend allows it.
One month, ten markets
From 1 to 31 October 2026 the rule took 363 trades on BTC, ETH, SOL, BNB, XRP, DOGE, LINK, AVAX, SUI and ADA. 354 of them closed. Added up per market, net of a 0.1% fee per round trip, 8 of the 10 markets ended in profit, and all ten together come to +59.67%.
- Best: LINK +29.38%, XRP +18.42%, ADA +14.64%
- Worst: SOL −24.59%, SUI −11.62%
- Wins and losses: 125 wins, 229 losses (35% of trades)
- Average win: +2.74%. Average loss: −1.24%. Profit factor: 1.21
- Biggest single loss: −4.40%. Biggest single win: +14.14%
- How trades ended: 56 at the target (average +4.17%), 102 at the stop (average −1.60%), 196 closed by an opposite signal (average −0.05%)
Why it works: lose more often, win bigger
Two trades out of three lose, and most of them hardly matter. An opposite signal usually closes a trade near where it opened, and a full stop costs about 1.6%. The 56 trades that reach the target pay for all of it, because each one is set at three times the risk. Stops sit at real structure, not a few ticks away, so the average risk was about 1.9% and a trade is often held for hours even on the 1-minute chart.
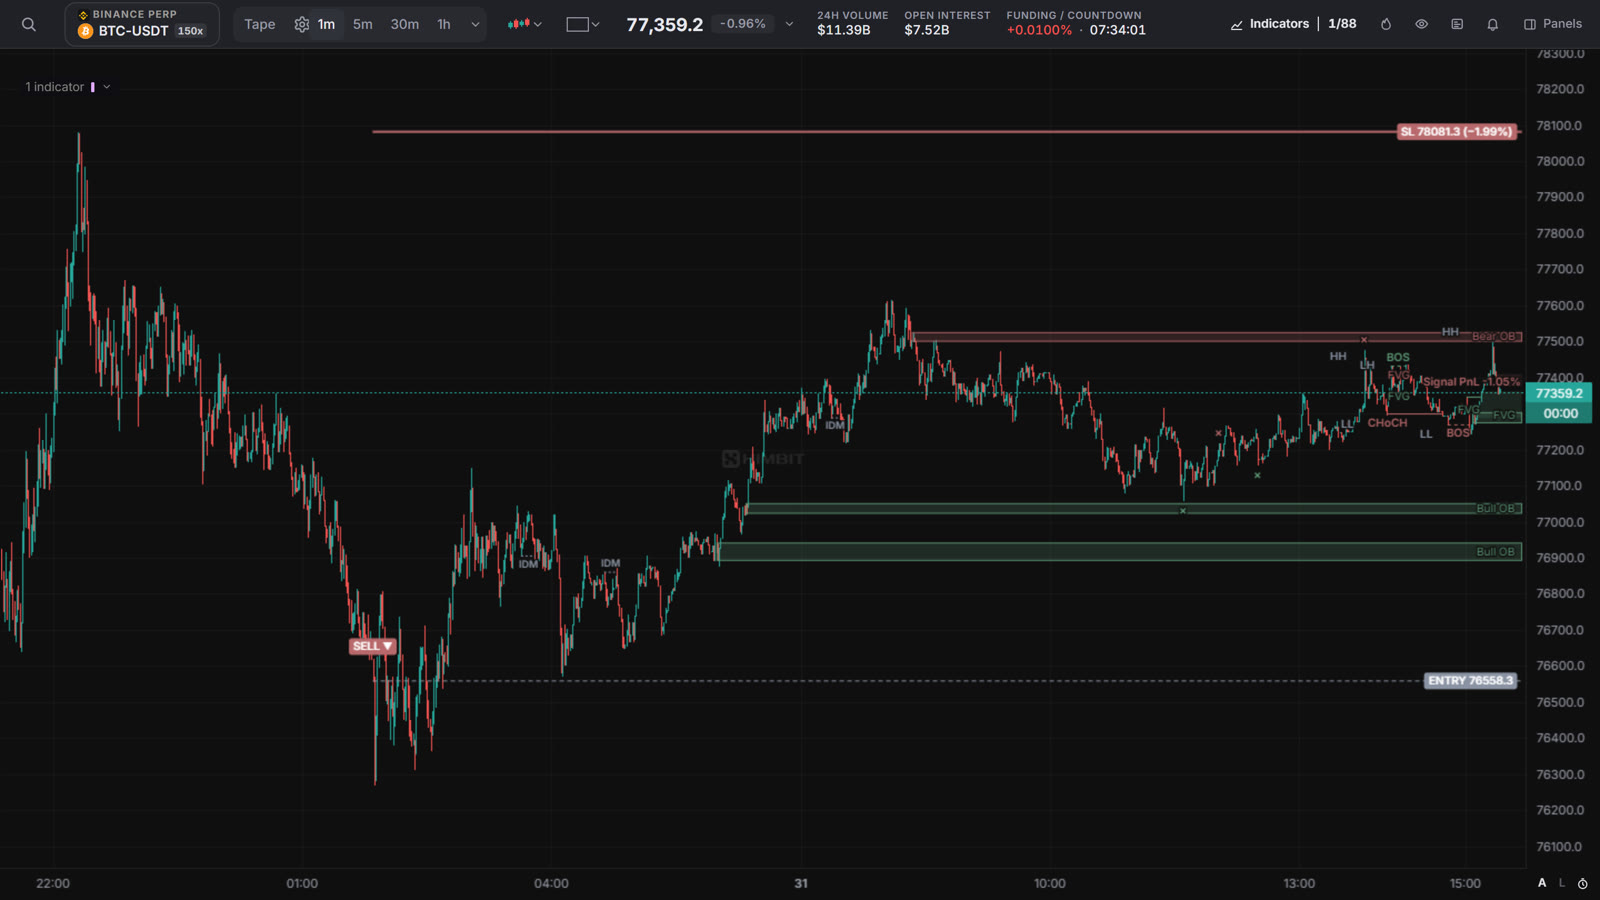
The losers matter too. SOL and SUI chopped around their EMA 200 for most of the month, and the rule kept paying full stops there. A month with ten markets is a small sample, and two of them lost a lot.
What to keep in mind
- This is a backtest, not a live account: no leverage, slippage or funding, and the 9 trades still open are left out of the totals.
- The totals add up the percentage of each trade. They are not a compounded account balance.
- The rule was picked by a backtest on Binance 1-minute charts in September and October 2026, so this month overlaps the data it was chosen on. On other timeframes it was not profitable in testing.
- The chart reads structure on the last 1000 bars, so its first trade can differ from a replay that starts earlier. The rule and every later trade are the same.
- This article explains a strategy. It is not investment advice.
Try it on your own chart
Open the Himbit chart for BNBUSDT 1m, click Indicators and add Price Action — SolAtlas. The Signals tab of its settings holds the structure window, the trend EMA and the target. The idea behind it is explained in the market structure lesson, and why three filters beat one in stacking indicators.
よくある質問
Is this a live trading record?
No. It is a backtest: the chart's own SolAtlas code replayed bar by bar on Binance 1-minute candles of ten perps, from 1 to 31 October 2026, net of a 0.1% round-trip fee, without leverage, slippage or funding. Nine trades were still open when we measured, and they are not in the totals.
Where can I see these signals myself?
Open the Himbit chart, pick a Binance market, switch to 1m and add Price Action — SolAtlas. BUY and SELL tags, the entry, stop and target lines and the result of each trade are drawn on the chart for free, with no sign-up.
Does it work on every timeframe?
No. The rule was picked by a backtest on 1-minute charts, and on other timeframes it was not profitable in testing. That study covered September and October 2026, so this month is not a clean out-of-sample test.
Himbitで取引を始める
Hyperliquidの無期限先物を自分のウォレットから取引 — 非カストディアル、KYC不要。